Features
Everything is set up from Settings in the browser and applied at once: nothing to restart, no files to edit.
Your services
"Is it my internet, or is the bank down?" Add any HTTP(S) or TCP service and it's checked every 30 seconds. When it fails while your connection is healthy, the verdict says it's that service.
For Argentina there are ready-made checks to tick: the tax agency ARCA (Clave Fiscal, e-invoicing WSFEv1, WSAA), Rentas Jujuy, Banco Macro, Banco Nación, Galicia, Santander, BBVA Argentina, Mercado Pago, Payway, plus Google Workspace, Microsoft 365, WhatsApp Web and Zoom.
Each one says exactly what it checks. Some use TCP because their HTTPS can't be checked fairly: ARCA's e-invoicing server uses a TLS setup modern clients reject, and Santander blocks automated clients.
Devices on your network
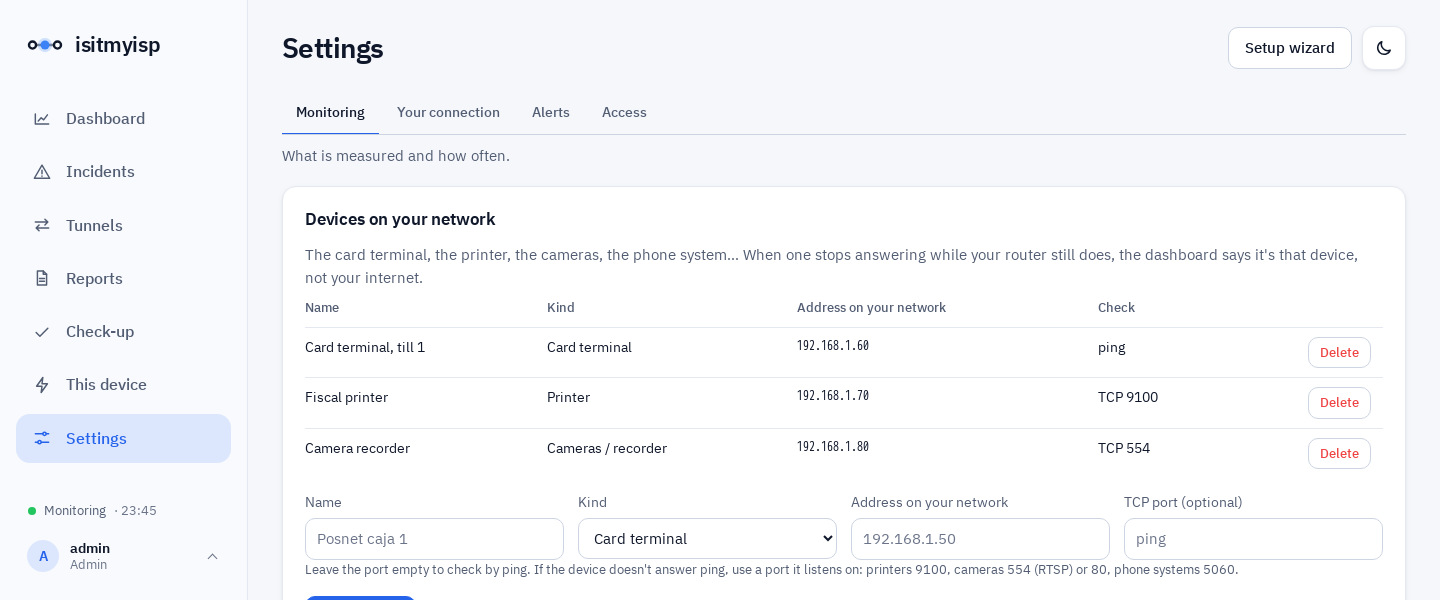
"Did the card terminal drop, or the internet?" Add the devices on your network in Settings → Monitoring → Devices on your network: the card terminal, the fiscal printer, the camera recorder, the phone system, the Wi-Fi access points.
- Each one is checked every 30 seconds by ping or, when the device doesn't answer ping, by connecting to a port it listens on: printers 9100, cameras 554 (RTSP) or 80, phone systems 5060.
- If it stops answering 3 times in a row while your router still answers, the dashboard, the alerts and the report say it's that device, not your internet or your ISP: check that it's on, its cable or its Wi-Fi.
- If what fails is your own network (the router doesn't answer), the device isn't blamed.
- They show in the Services, devices and tunnels card of the dashboard and on the TV board.
- Here, and only here, private addresses (192.168…, 10…, 172.16…) or local names (
printer.local) are accepted. Internet addresses go in Your services.
Opening hours
For a shop, 20 minutes without internet at 3 a.m. isn't the same as at 11 a.m. Set your hours in Settings → Alerts → Opening hours (or in the wizard): per weekday, with up to two shifts, such as a split shift with a lunch break.
With hours set:
- The dashboard adds "While open: 14 min" to the last 24 hours' summary, and TV mode shows a While open figure.
- The report adds how long the business was open in the period, how much of that time had problems, and marks each incident "while open" or "while closed".
- Held alerts (optional): while closed, nothing reaches you. At opening time you get one summary of what happened, such as "While closed: 2 problems". A problem still going on when you open is alerted as usual.
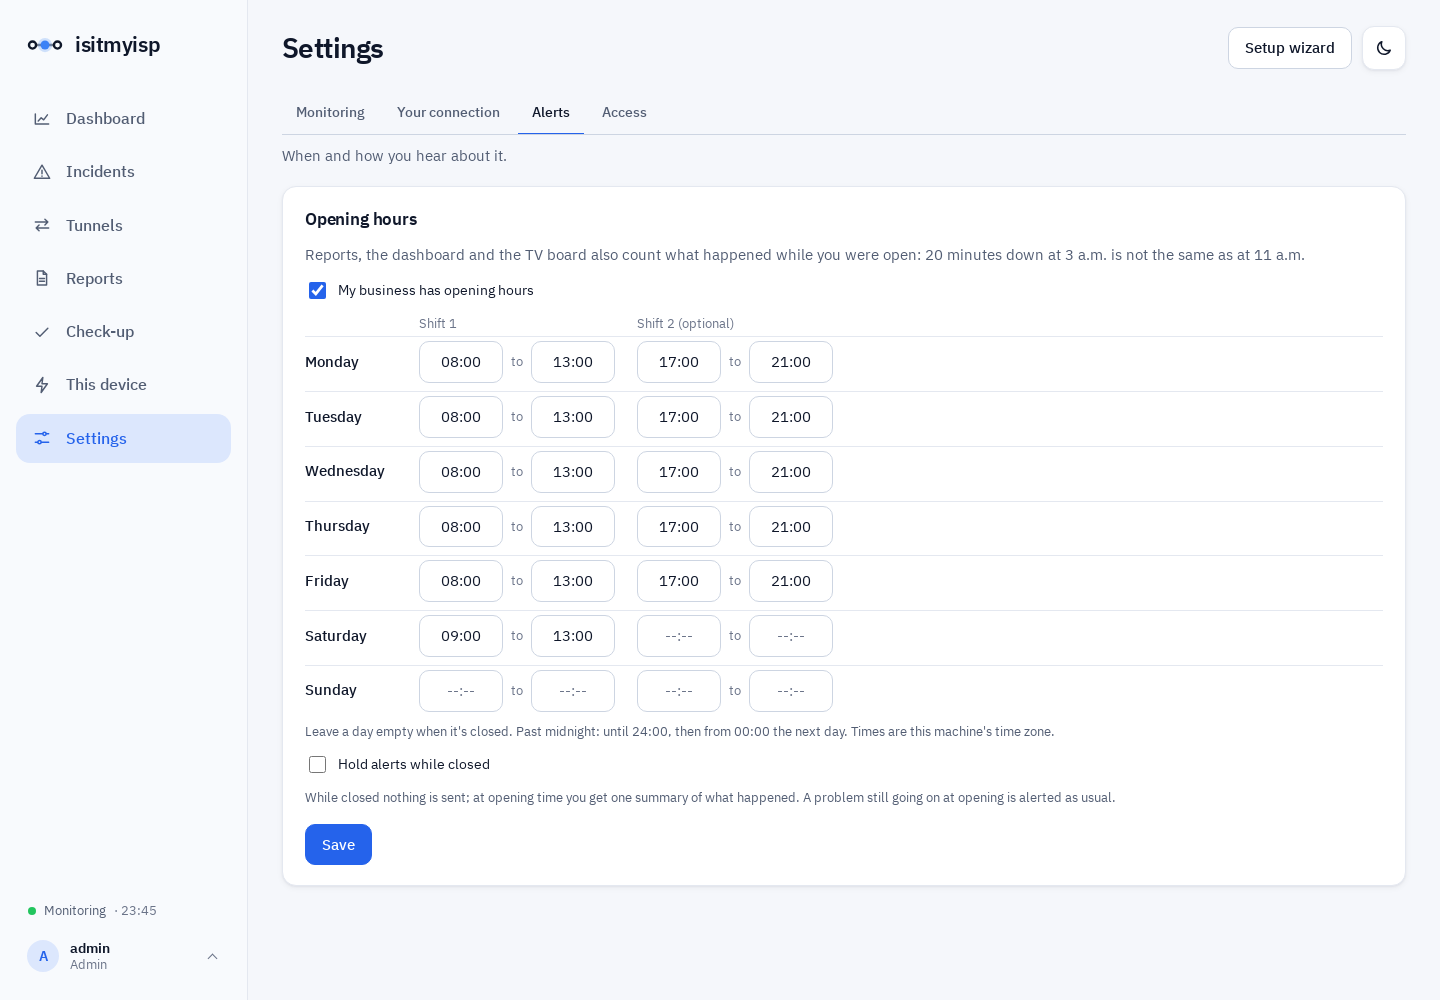
For a shift past midnight, enter it in two parts: until 24:00, and from 00:00 the next day. Hours use the time zone of the machine running isitmyisp.
VPN tunnels
Did the branch tunnel drop because of its configuration or because of the path? isitmyisp measures outside and inside the tunnel at once:
- Outside (
underlay): the far end's public address. - Inside (
overlay): an address on the far side, reached through the tunnel.
| Through the tunnel | Outside | Verdict |
|---|---|---|
| fine | — | up |
| failing | clean | tunnel configuration: DPD, IKE/IPsec lifetimes and rekey, NAT-T, MTU/MSS |
| failing | losing too, your internet fine | the far site or the path to it |
| failing | losing too, your internet bad | your connection |
| failing | the far end never answers ping | can't tell (it filters ICMP) |
When configuration drops repeat at a regular interval, the report flags it: that's almost always mismatched rekey timers between both ends.
Backup link (failover)
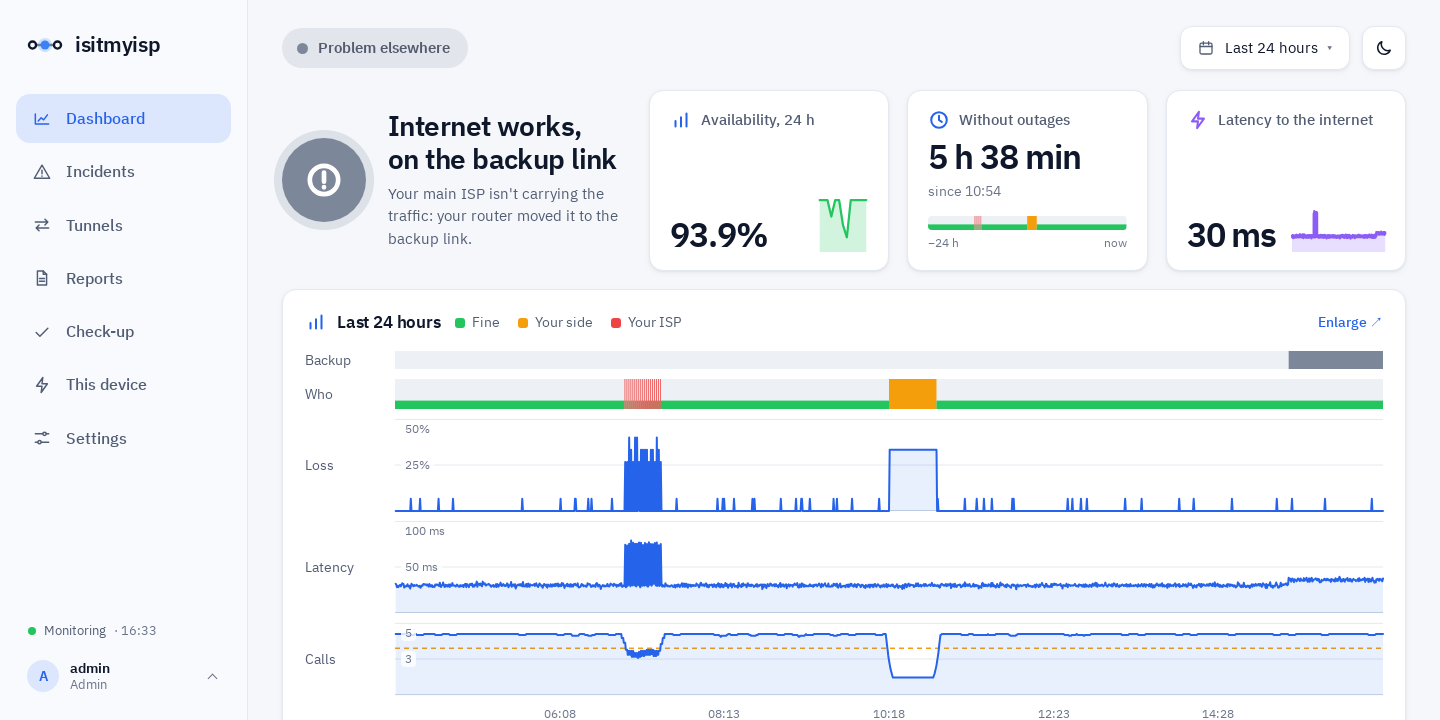
With a dual-WAN router, isitmyisp notices within about a minute when traffic moves to the backup link and when it comes back. It does this by watching which ISP router is first on the path. The dashboard says "on backup", and the report says from when to when the main ISP wasn't carrying the traffic.
Call quality
Would a call sound good right now? An estimated MOS from 1 to 5 (ITU-T G.107 E-model), from the latency, jitter and loss it already measures. If you have a phone system or SIP provider, set its address to measure against it. It's an estimate, not a real call, and the dashboard says so.
Speed test
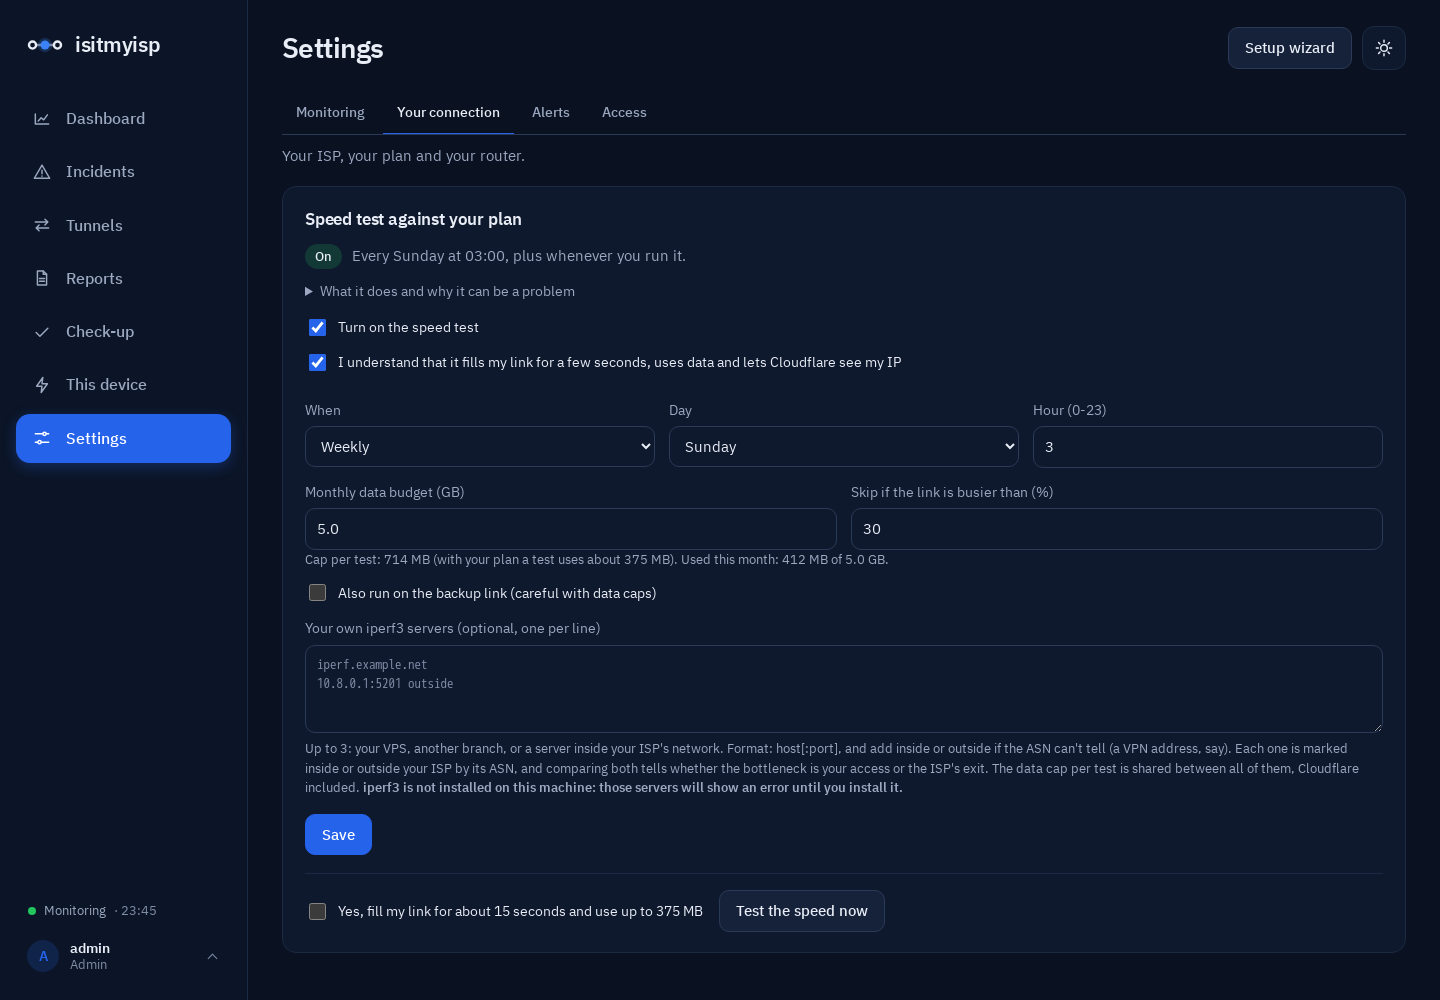
Off by default, on purpose. It fills your link for a few seconds and uses data, so it ships disabled, explains why, and asks you to accept the risks before turning it on.
When it's on:
- It runs weekly (Sunday at 3 a.m. by default), daily at the hour you pick, or only when you press "test now".
- It keeps to a monthly data budget (5 GB by default).
- It never runs on the backup link or over the budget.
- A scheduled test also waits out an incident and a busy link (above 30 % by default). "Test now" runs anyway: you asked for it.
- It measures against speed.cloudflare.com, which sees your public IP.
- It also measures latency with the link full (bufferbloat) and warns when the result is limited by your Wi-Fi rather than the ISP.
- While it runs, those windows don't count towards the verdict.
Inside and outside your ISP
Cloudflare alone can't tell a slow access from a slow exit. In Settings → Your connection → Speed test against your plan you can add up to three iperf3 servers of your own: a VPS, another branch, or a server inside your ISP's network. One per line, as host[:port] (5201 by default).
Each server is marked inside or outside your ISP by its autonomous system (ASN), against your ISP's. An address in the ISP's CGNAT space counts as inside. A LAN or VPN address can't be told apart, so write inside or outside after it (10.8.0.1 outside). Marking by ASN needs the ASN data (Settings → Your connection → Main ISP and backup link) or --asn-online.
With one server on each side, the dashboard and the report compare the best download of each:
| Result | What it means |
|---|---|
| The ISP's exit | Outside is under 60 % of inside, for example 300 Mbps up to the ISP and 40 to the rest of the internet. The bottleneck is its peering or transit, not your access. |
| The access | Inside and outside are alike, but even inside the ISP you get under 60 % of your plan. The limit is your access link. |
| No bottleneck at the exit | Inside and outside are alike. |
The guards still hold: the data cap per test is shared between Cloudflare and your servers, it doesn't run on the backup link, and a scheduled test still waits out an incident. It needs the iperf3 program on the machine (the Docker image ships it), and each server sees your public IP.
The router over SNMP
Every ISP's favourite objection is "you saturated your own link". Connect your router over SNMP (v2c, read-only) and isitmyisp reads the WAN interface usage and CPU every window. That rules out the objection, or tells you they were right. It needs your plan's speeds (Settings → Your connection → Your contracted plan) to know when the link is full.
It also reads the broadcast and multicast each router interface receives: a storm on the LAN (a loop between switches) shows up there, next to the CPU. See loops and broadcast storms.
TV mode
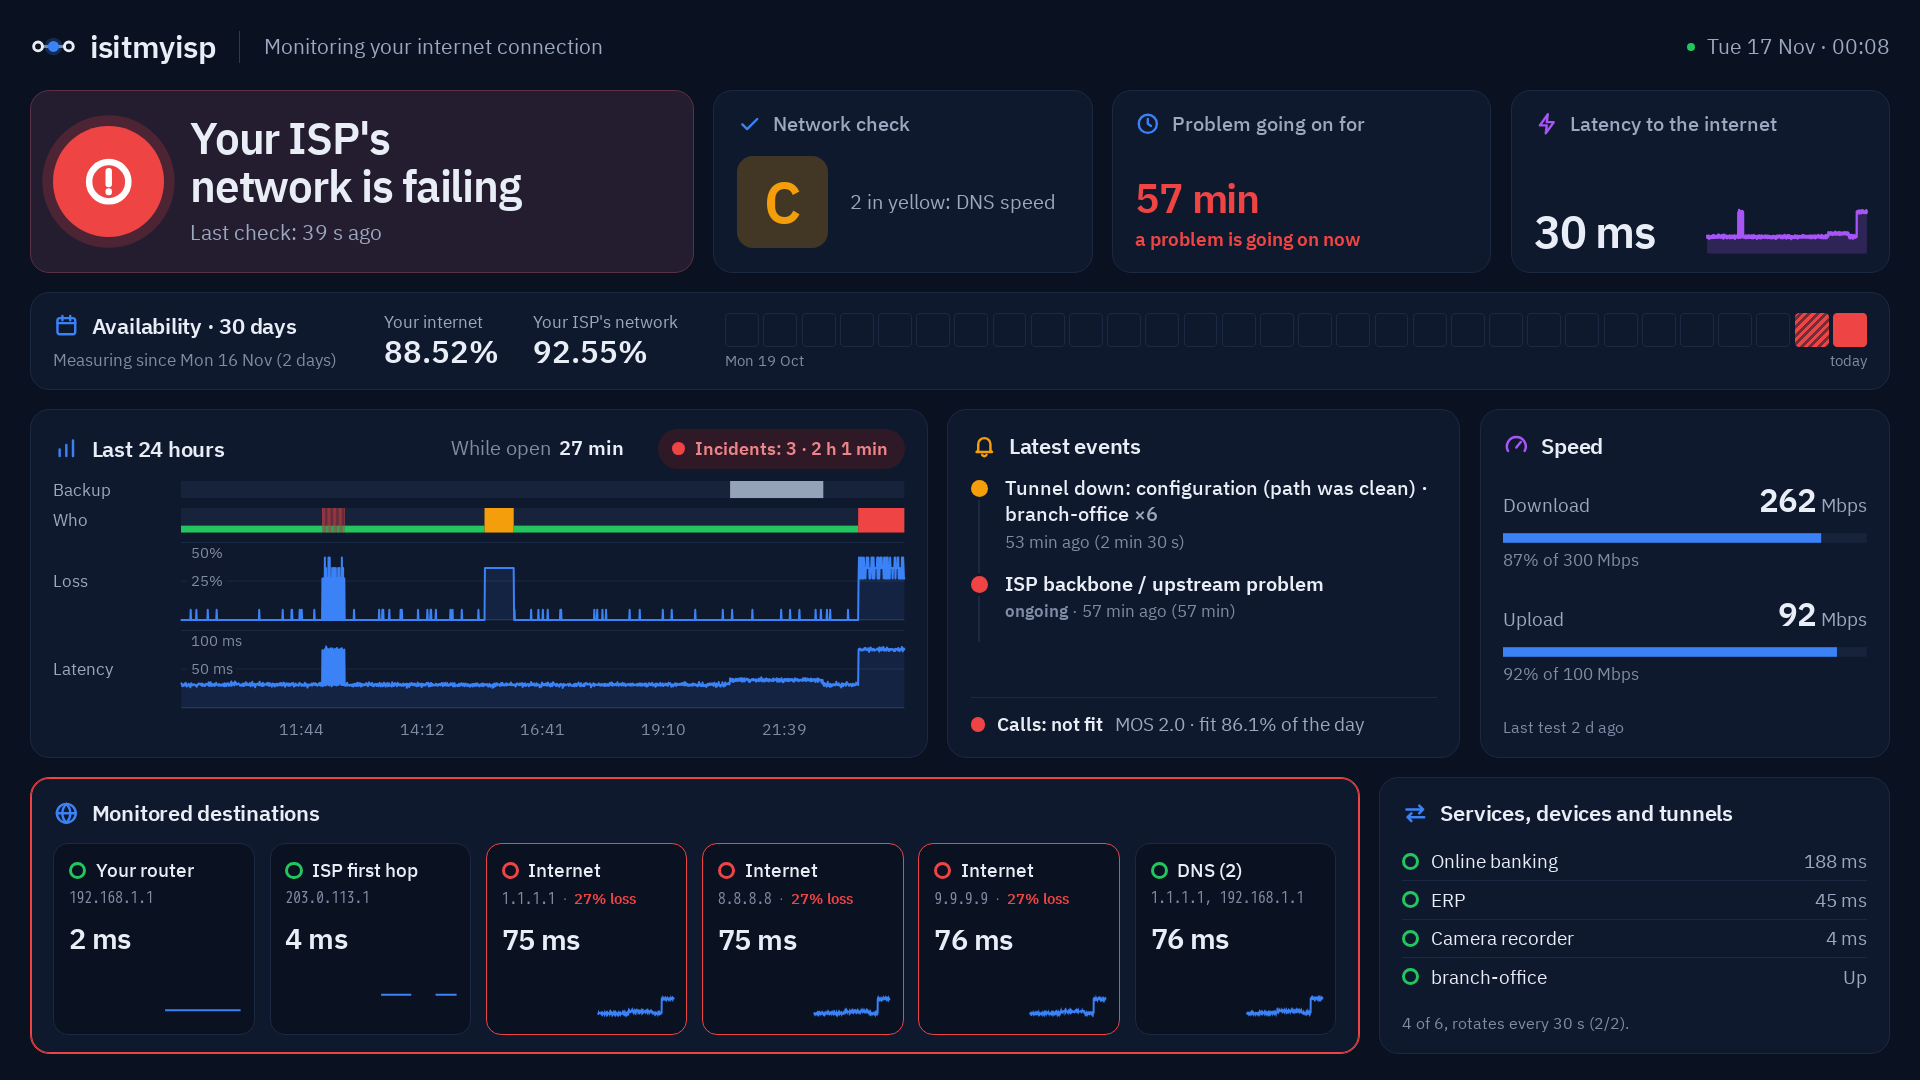
A board for a screen on the office wall: large type, refreshes by itself, no menus or login. See it in the demo.
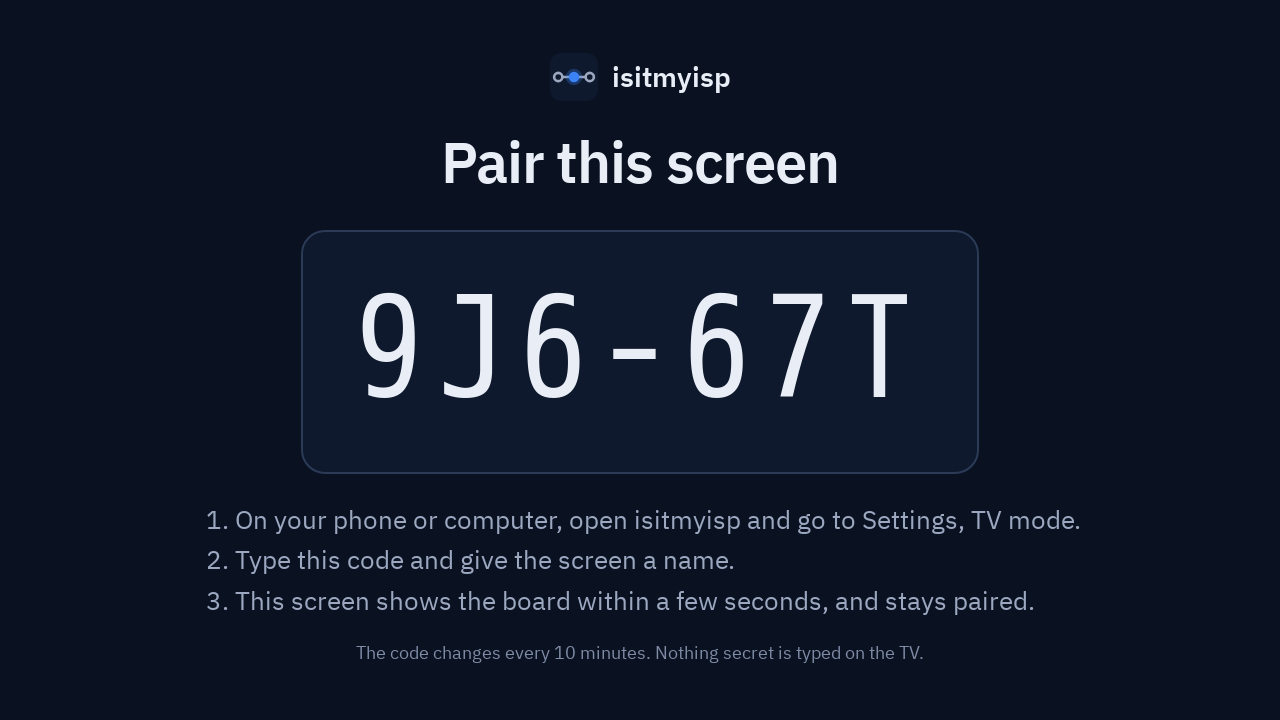
To put it on a TV, without typing anything long with the remote:
- On the TV, open the dashboard's address followed by /tv, for example
192.168.1.50:8080/tv. - The TV shows a short code, like C4R-HN9.
- From your phone or computer, in Settings → Access → TV mode, type that code and name the screen ("Counter TV").
- Within a few seconds the TV shows the board, and stays paired: after a power cut or a restart it comes back to the board on its own.
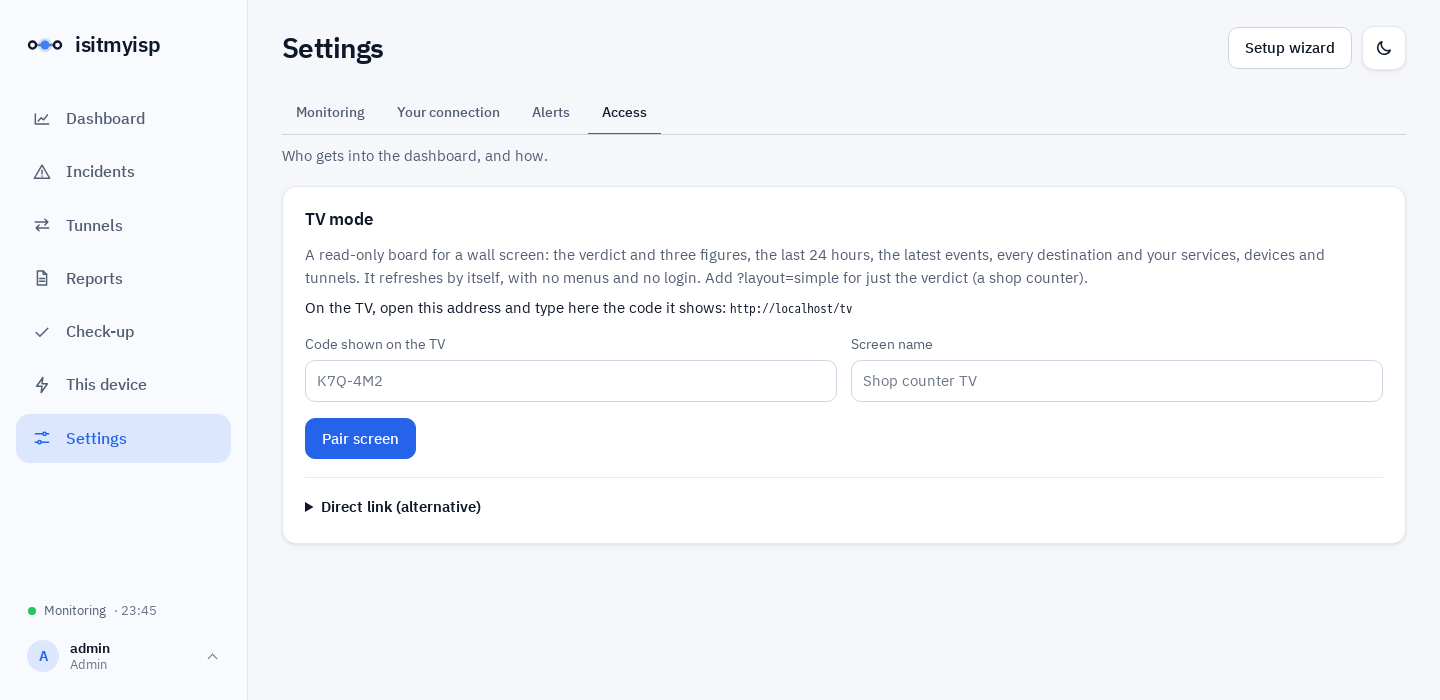
For the TV to reach the dashboard, the dashboard has to be reachable from your network, which is what the installer does by default. If you installed it with --local, run it again without that option (see Install); your data is kept.
The code expires after 10 minutes and works once. Settings → Access → TV mode lists the paired screens and can unpair any of them. If you'd rather paste a link, there's also a secret, revocable direct link.
It has two views:
- Board (default): the verdict and three figures (the network check grade with its first problem, or 24-hour availability until the check has run; time without outages or with problems; latency), availability over the last 30 days day by day, the last 24 hours beside the latest events and call quality, the latest speed test against your plan (when it is on), every measured destination and your services, devices and tunnels. Each block shows only when it has data. Whatever is down is named at the top in red, destinations losing packets are marked in red, and long lists rotate on every refresh. It fits any screen from 720p to 4K with no scrollbars.
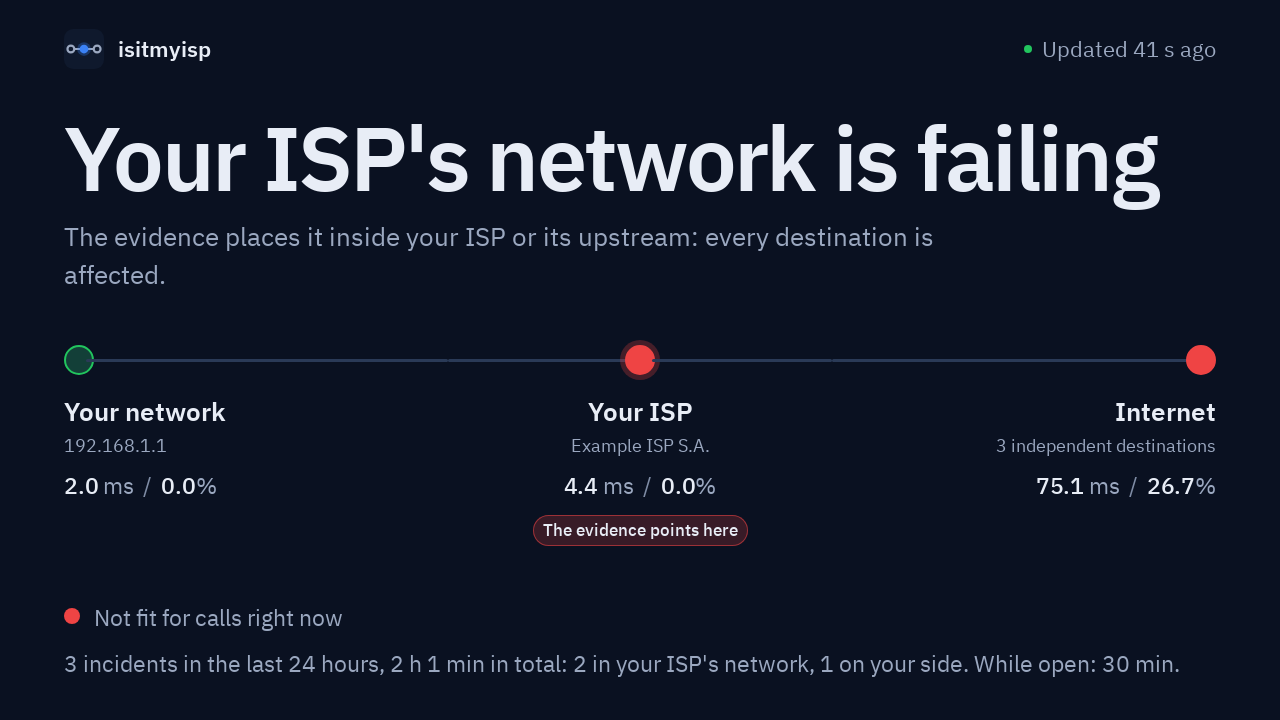
- Simple (
?layout=simple): just the verdict, for a shop counter. See it in the demo.
Users
- Admin: changes settings, users and alerts.
- Viewer: sees the dashboard, incidents and reports, and changes nothing but their own password.
Admins invite people with one-time links that expire in 48 hours, reset passwords and can disable an account, which ends its sessions at once.
Metrics and API
| Path | What |
|---|---|
/metrics |
Prometheus, with a token shown in Settings → Access |
/api/status |
Current state as JSON (when logged in) |
/healthz |
Public; only says whether it's alive |
/report?since=7d |
The report as HTML |
/report.pdf?since=7d |
The report as PDF |