The dashboard
The dashboard refreshes itself every 30 seconds. The answer is at the top; the evidence is below it.
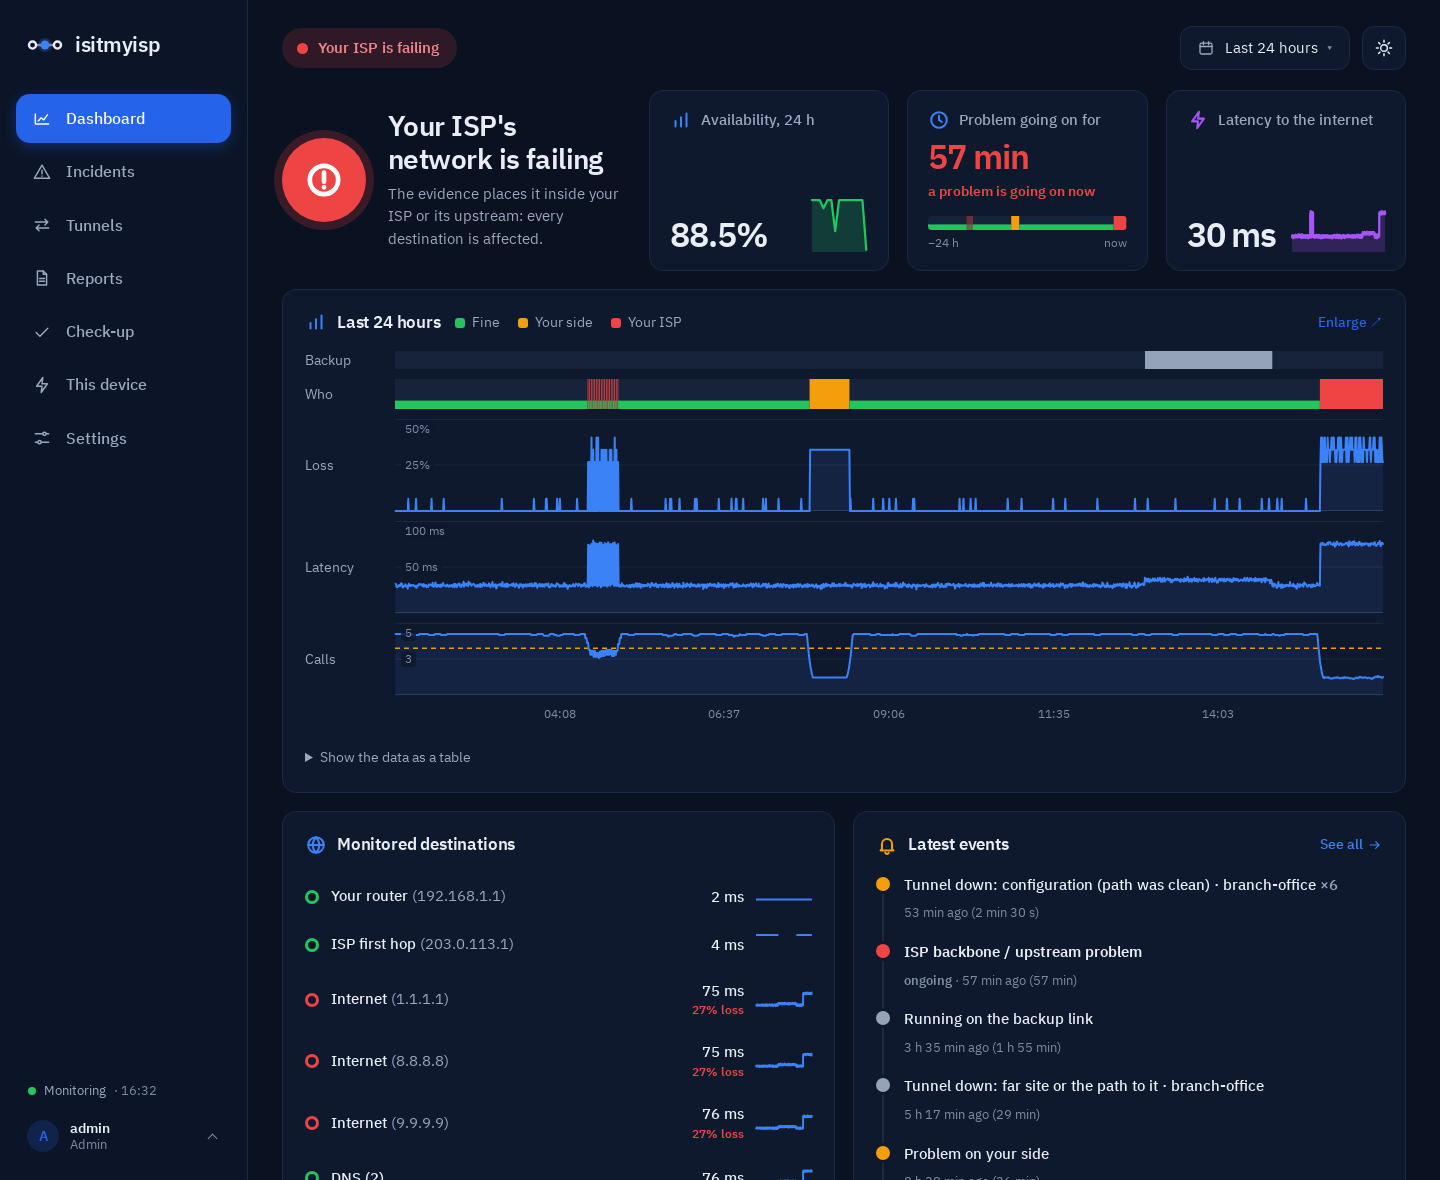
Colours mean whose side it is
Throughout the dashboard, colours mean responsibility, not "good or bad":
| Colour | Means |
|---|---|
| Green | Working fine |
| Orange | The problem is on your side: your Wi-Fi, your network or your router |
| Red | The problem is in your ISP's network |
| Grey | Others: a single service, a remote site, or it can't be told |
Colours always come with text or an icon, so they still read if you can't tell them apart.
At the top: the status and the theme
- The status pill sums it all up in a couple of words: "Connection stable", "Your ISP is failing", "Problem on your side"…
- The moon or sun button switches between light and dark mode and remembers it in that browser. Until you press it, the dashboard follows your system's setting.
The verdict and the three figures
On the left is the verdict in one sentence ("Your ISP's network is failing", "The internet is working"), with a large icon in the colour of whoever is responsible. Beside it are three figures, each with a small chart of the last 24 hours:
- Availability, 24 h: how much of the measured time the connection worked. The arrow compares it with the 24 hours before.
- Without outages: how long since the last problem with your connection. While one is going on, the card turns into "Problem going on for" and shows its duration in red. Underneath, a strip of the last 24 hours: green while fine, and the colour of whoever was at fault in each outage. Click it to see that day enlarged.
- Latency to the internet: the median time the internet destinations take to answer. When it went down compared with the day before, the arrow is green.
Last 24 hours
A timeline with several rows on the same time axis:
- Who: whose fault it was at each moment.
- Loss and latency to the internet.
- Calls: estimated call quality, if set up.
- Backup: when the office was on the secondary link, if it happened.
Hover to read each moment: every column is 15 minutes, with the average loss and, when one window had a higher spike, the peak. Below it there's a table view with the same data.
Enlarge and zoom
Enlarge (top right of the chart) opens it full size:
- Drag across the chart to zoom into that stretch, like in Grafana. Double-click to zoom out.
- Pick the range with the button at the top: quick ranges (from the last 15 minutes to the last 30 days) or an exact range, with a start and end date and time. The Last 24 hours button on the dashboard opens the same picker.
- ← and → move earlier and later by the same length; Zoom in and Zoom out change the zoom; Now goes back to the present.
Up to an hour and a half, every column is one 30-second measurement window, with its exact loss. A drop of a few seconds stops being a thin line: the table below says when it was, how much was lost and how long each destination took to answer.
It also works with no JavaScript: zooming and moving are links, and a click on a column zooms into it. The one script is the dragging, and all it does is build the link of the stretch you selected.
Monitored destinations
Every measured destination, with its current latency and a small chart of the last 6 hours: your router, the ISP's first hop, the internet destinations and your DNS servers. The coloured dot says how it's doing. When a destination loses packets, the percentage shows in red under its latency. Click one to see its loss and latency enlarged, with the same zoom.
Latest events
Recent incidents, newest first, with how long ago they started and how long they lasted ("2 h ago (5 min)"). When the same problem repeats close together it's folded into one line (for example "×4"). "See all" leads to Incidents, with each one's full evidence.
Where the problem is
The path: Your network → Your ISP → Internet, with the latency and loss of each segment. The point with the problem is marked "The evidence points here". If the office is on the backup link, the ISP segment says so.
Below the path:
- What to do, depending on who is responsible.
- The active incident, if there is one, with its evidence, what the evidence rules out (your LAN, ICMP noise, a single website being down and, if you connected the router over SNMP, a link full of your own traffic) and what it can't.
- The day's summary and the buttons for the report for your ISP (HTML or PDF).
- Brief drops: problems shorter than a minute, too short to become an incident.
Your link, calls, services and tunnels
- Your link (from your router): how much of your plan is in use right now, if you connected the router over SNMP. Above 85 % it's marked as full. Below it, the latest speed test against what you pay for. If you added iperf3 servers, a table with what each one gave, marked inside or outside your ISP, and whether the bottleneck is your access or the ISP's exit (how it's decided).
- Call quality: the estimated MOS (1 to 5) and whether a call would sound good now.
- Services, devices and tunnels: whether each one answers, how fast and since when. Devices on your network (card terminal, printer, cameras…) show their kind and address.